
How much repricing do we need in covered bonds?
Jun 18th, 2015
In this article Florian Eichert, senior covered bond analyst at Crédit Agricole CIB, tries to assess at what point we will have a more normal covered bond market again that does not just rely on what the Eurosystem does or does not do.
There are many different ways investors look at relative value for covered bonds. Asset managers might look at bonds differently from bank treasuries. French investors might take a different approach to German accounts. And even within these groups there are different approaches. To make matters worse, the relevant benchmarks are quite fluid and change over time.
We have, however, reached levels where the covered bond market is struggling to gain traction – something that is true irrespective of which approach to determining relative value is used – and even new issues that offer substantial new issue concessions are no easy sells.

RELATIVE VALUE
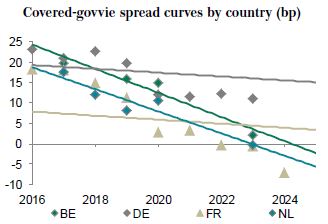
The Covered-sovereign spread
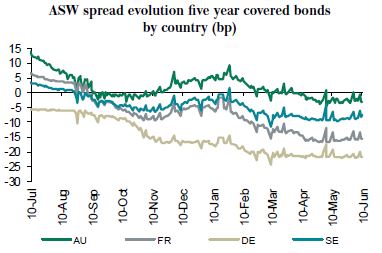
One relationship that many investors have looked at during the recent volatile weeks has been that with the underlying sovereign. Covered bonds have remained extremely stable compared with sovereign debt, highlighting one of the qualities of the asset class. With the exception of five year Austrian paper, sovereign debt volatility as measured by the 90-day standard deviation of asset-swap spreads has been a multiple of that of covered bonds.
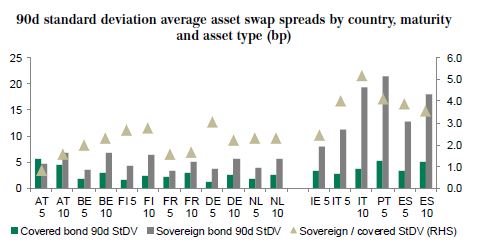
However, as a consequence of this higher level of stability in the covered bond space, the difference between the two has come down quite significantly across the board:
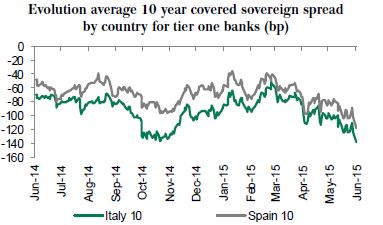
- In peripheral markets we are again at negative spreads in excess of -100bp for the top names at the long end.
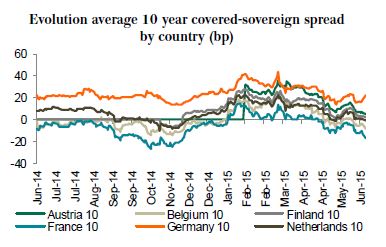
- In core sectors, French covered bonds at the long end trade through OATs again, for example, while 10 year Pfandbriefe are again around 20bp wider than Bunds, a difference that has almost halved since mid-February.
When looking at relative value between the two markets, there is no “one size fits all” formula that investors could use to come up with a fair spread. For bank treasuries, we can calculate a minimum pick-up to cover the extra capital (higher risk weight) and funding cost (higher haircut) from LCR level 1A to 1B/2A levels based on the additional capital cost and funding cost of the haircut of covered bonds. For 1B covered bonds, we would be talking about 10bp-15bp, for 2A around 20bp-25bp, in our view.
We do not only have bank treasuries buying, however. Many real money asset managers do focus on this spread as well, and for them there is no regulatory angle we could take to determine fair value. It is thus probably better to look back at which levels have led to what degree of activity in the last few months:
- Pfandbriefe really started to struggle to advance further once they moved inside 20bp over Bunds. Investor demand and trading activity really slowed down.
- In other core markets, trades at negative spreads to sovereign debt took place, but they were few and far between. However, at levels of 10bp-15bp we saw demand in secondary as well as primary markets.
- In peripheral markets such as Italy and Spain, there was trading and also new issuance at levels deeply through BTPs and Bonos, but investors really started to hurt when pushing the buy button from around 50bp through sovereign debt for tier one issuers.
In other words, we would need to see covered-sovereign spreads move around 10bp-15bp wider in core sectors to reach the levels mentioned above, while in peripheral markets we are talking about a multiple of this number.
When comparing covered bonds to sovereign debt, though, one should not forget to look left and right for potential additional drivers that could move the spread:
- A Pfandbrief-Bund spread might look attractive at 30bp. If we are looking at a bond trading at a negative yield, however, investors might still not buy.
- If the ASW spread level of a covered bond is so deep in negative territory that we are well below any funding level of banks and inside three or sixth month Euribor levels when swapped, we might be waiting for the 30bp to become 20bp for a long time without anything actually happening.
Additional limitation 1: negative yields
Even though hardly any investor out there has clear rules that prevent purchases at negative yields, many have nonetheless tried to avoid buying below 0% at all cost. Even CBPP3 tried to avoid this and has bought at negative yields on only very few occasions. The spread difference to sovereign debt has in those cases been almost irrelevant.

In fact, we have seen covered-sovereign spread curves strongly inverted as the shorter end was kept close to the 0% yield level while short-dated govvies were as much as 28bp in negative yield territory. This did push the spread over govvies wider, while the much steeper govvie curves compared with covered bonds led to tighter covered–govvie spreads towards the longer end.
Fortunately, negative yields have become a much less pronounced issue in covered bond markets. We did have close to 20% of the market yielding below 0% at one point. This number has now come down to a mere 2%, with the only negative yielding bonds coming from Finland, Germany and Sweden. We are also only talking about 2016 maturities at most.
Negative yields are therefore no longer a major limiting or distorting factor for the covered-sovereign spread relationship at this time, in our view.
Additional limitation 2: bank treasuries’ internal benchmarks
Bank treasuries look at covered bonds in a number of different ways that can all place an additional limit on the spread level they are happy to accept:
- Spread against their own funding
- Swapped levels are compared against six month Euribor, three month Euribor or EONIA
- Spread against LCR Level 1A assets (sovereign debt and SSA paper)
- Absolute yield.
The compression across countries and issuers has aligned the funding costs of individual banks more closely. Funding levels are, however, still different from bank to bank, even from maturity to maturity. Consequently, what can be attractive for one bank is not attractive for another. We can therefore not really derive any general statement from this approach about which spread levels we need to see before accounts get back into the market more actively.
As mentioned above, on the LCR comparison we have run simulations in the past that put the fair spread between a 0% risk-weighted Level 1A sovereign bond and a 10% Level 1B covered bond in the region of 15bp. For 20% risk-weighted 2A covered bonds, the difference is more in the 25bp region. Since many banks are exceeding their LCR targets, this approach for the time being has become a little less relevant. We have spoken to accounts that would rather let some LCR portfolio assets mature and the LCR ratio fall slightly than invest at levels that might be in excess of what is needed above sovereign debt for LCR purposes but too tight versus their own funding.
We can, however, draw conclusions that are relevant for the wider market when looking at the behaviour of those accounts for whom the comparison is to three or six month Euribor or Eonia swapped levels.
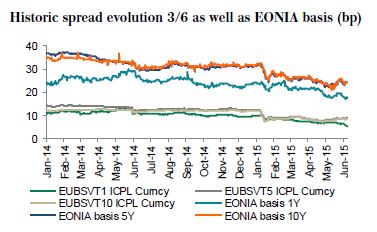

Bank treasuries typically swap their fixed-rate investments down to a floating rate either versus six or three month Euribor or even versus Eonia. Bonds they buy should ideally pay a positive spread after swapping them from a fixed rate down to the respective floating rate:
- For those accounts using six month, generating a positive spread essentially means that bonds need to pay a positive level versus swaps. These accounts are virtually kept outside the covered bond market for now as core bonds are largely in negative territory versus swaps, while in many cases credit lines for peripheral markets are not yet fully open (even if they are, interest is low).
- Those benchmarking against three month Euribor do at least gain the 3/6 basis, which is currently a high single-digit basis point number. In other words, for their positions to yield a positive spread they can be as low as -5bp to -10bp versus swaps depending on the maturity. While this does not open the whole market, it does extend the potential universe in which they can invest.
- Those benchmarking against EONIA gain the EONIA basis, which currently is in the mid-20s range. Consequently, apart from the tightest part of the Pfandbrief market, these accounts can essentially play in the whole market.
It is hard to say which approach is most commonly used. In Germany, for example, many accounts measure against six month; in France, on the other hand, three month and even in a few (but large) cases EONIA are being used.
Irrespective of the benchmark used, the desire to stay in positive spread territory is strong but not absolute. Bank treasuries can buy at negative spread levels, especially when they are based in a country such as Germany where higher yielding alternatives are few and far between and where funding costs for banks are extremely low.
Nonetheless, at ASW spread levels that are a double-digit basis points number in negative territory the natural demand for covered bonds is limited mainly to three types of investors:
- Bank treasuries that are forced to buy as they are limited by risk departments and can’t move elsewhere, while at the same time having to invest money (unless they’re happy to park it at -20bp at the ECB).
- Dedicated covered bond mandates of asset managers that do not want to hold cash, for which they are sometimes charged in excess of the ECB deposit rate of -20bp.
- CBPP3 accounts that have a volume rather than a return target.
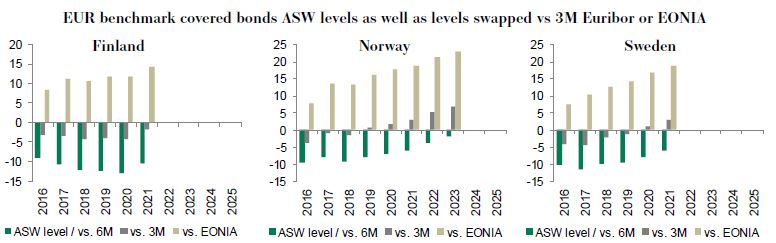
Below we have shown where there are positive spread levels based on the approach taken (versus six or three month Euribor or EONIA) in selected markets by maturity.
AT WHAT POINT DO WE SEE RELATIVE VALUE?
Core
In five year core covered bond sectors we would need to see the following levels versus sovereign debt to have a better functioning market again that does not rely solely on CBPP3 demand and some forced buyers:
- Germany: 25bp-30bp versus Bunds
- Belgium, Finland, Netherlands: 20bp-25bp versus their respective sovereign curves
- France: 10bp-15bp versus OATs
Compared with today, we are thus talking about roughly 10bp of widening in most cases. That 10bp would bring the relationship to sovereign debt back into line and also mean that five year sectors such as Dutch, Finnish or French covered bonds would be trading at only a mid-single-digit basis point number through swaps versus the current -15bp to -20bp. This in turn would be enough to bring bank treasuries that look at levels versus three Euribor back into the picture.
Sectors such as the UK, Canada or Australia, which trade around 5bp wider than the above-mentioned sectors, would not have to widen quite as much to reach levels where they are at least in line with minimum return requirements for those treasuries benchmarking against three month Euribor.
Whether investors are happy to buy the moment we reach these levels in today’s volatile markets is another story. Valuations can also always overshoot in illiquid markets. In our view the levels above would eventually lead to more normal investor demand and, in the event of an overshooting, we should return to that range.
Periphery
In peripheral markets the situation looks a little different:
- After all, peripheral markets are mostly not facing the negative spread levels versus ASW and three or six month Euribor that core sectors are. These considerations are thus not a major driver as they are in core markets.
- At the same time, asset managers riding the compression trade to core sectors that had been focusing on the ASW spread differences to core sectors are less of a factor these days as the rally is virtually over.
- Consequently, the focus has been a lot more on the spread to domestic sovereign debt.
We are not saying that spreads have to be positive to have a functioning market. There has been issuance at deeply negative spread levels, especially by the tier one names from Italy and Spain. However, the current levels of 100bp and more inside their sovereign curve at the 10 year point and -60bp to -70bp in five years are not sustainable in our view, and already Banco Sabadell’s five year deal – which was priced around -40bp through Bonos – highlights this.
In our view the following levels in five years would lead to a market functioning more normally again that can see sustainable new issuance:
- Italy, Spain tier one banks: -30bp to -40bp versus BTPs and Bonos
- Italy, Spain second tier names: -10bp to -20bp versus BTPs and Bonos, with a flat or even positive level being ideal.
In 10 years we would look for:
- Italy, Spain tier one banks: -40bp to -50bp versus BTPs and Bonos
- Italy, Spain second tier names: -20bp to -30bp versus BTPs and Bonos
The adjustment of around 30bp versus the underlying sovereign in five years (and up to 50bp-75bp in 10 years), however, would not have to come from ASW widening of peripheral covered bonds, it can also eventually come from the sovereign bond markets. Should core bonds widen by the above-mentioned 10bp, we would rather initially expect peripheral bonds to go wider more or less in parallel in the absence of substantial new issuance and a nasty Greek-related move in the sovereign bond markets of these countries.
Most issuers can in fact sit tight and wait for the bulk of the adjustment to come from sovereign bond tightening or in the meantime focus on the short end of the curve where levels are not as deeply negative as at the long end. Only should the relationship not finally normalise from the sovereign side of the equation would peripheral covered bonds have to widen versus ASW beyond the 10bp mentioned above for core sectors.
Bottom line
Covered bond markets have weathered the recent volatility in rates markets extremely well. Volatility here has been a fraction of that in other sectors such as sovereign debt.
Nonetheless, the current covered bond market feels very heavy in primary as well as secondary markets. The rates volatility had led to many investors becoming rather inactive in secondary markets, a fact that can also be seen by the CBPP3 slowing down to only around Eu400m of secondary market purchases versus the programme average of Eu500m. And last week has shown that primary markets can also be a struggle for issuers despite the higher absolute yield levels and rather generous new issue concessions.
At current tight levels versus sovereign debt and deeply negative ASW spread levels covered bond markets simply aren’t functioning properly as the natural demand from private sector investors is missing, and buying in secondary markets is almost exclusively limited to the CBPP3 doing its daily rounds.
To get to a more normal market where private sector investors are also on the buying end of a trade, where CBPP3 is not involved in every single ticket, and where issuers can successfully access primary markets without the presence of major execution risk, we would need a repricing of covered bond spreads.
In our view around 10bp of spread widening in core Eurozone covered bond sectors versus swaps would bring back more bank treasuries and make covered bonds fairly valued versus sovereign debt again.
In combination with higher outright yields this should actually bode well for covered bond demand, at least once rates show some signs of stopping the unpleasant habit of moving all over the place in 20bp intra-day swings.
Non-Eurozone sectors that are not as deep in negative ASW territory would in this case be pushed wider as well, but the widening should be less pronounced as they would start the adjustment process from a higher absolute spread level.
For peripheral markets the adjustment would in theory have to be much more pronounced than the 10bp mentioned above given the deeply negative spreads to the underlying sovereign bond markets. In the absence of new issuance that could lead to a repricing, however, we can very well remain in the current distorted situation given CBPP3’s presence. We would thus expect peripheral markets to move wider in parallel with core sectors and any excess widening to be related to Greece’s impact on the sovereign bond space than where private sector demand would realistically come back in.


